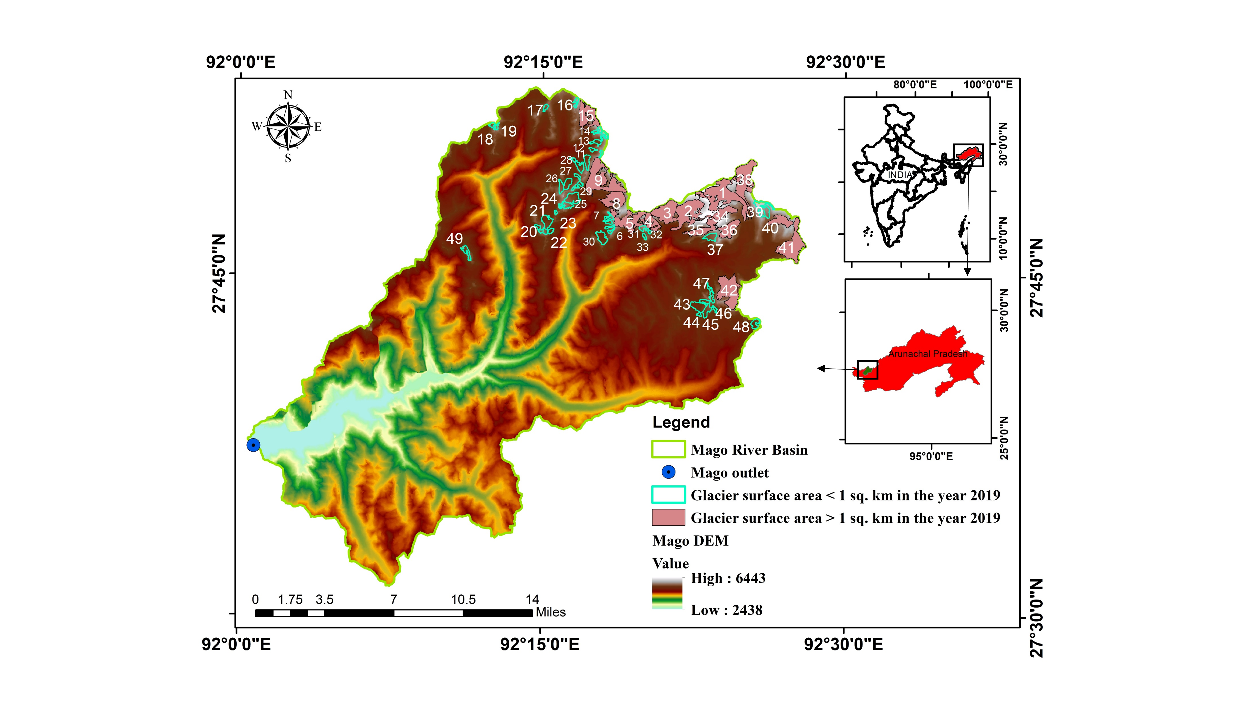
The study of changes in glacial parameters is necessary for the estimation of the melt contribution to the streamflow, water resource management and mitigation of glacial hazards. Analyzing the changes through field measurement is not feasible due to harsh climatic condition and inaccessible areas, led to very limited information on glacial parameters in the Arunachal-Himalayan region. The Soil and Water Conservation Engineering section, department of Agricultural Engineering, NERIST, analyzed the changes in glacier surface area, annual equilibrium line altitude (ELA), and accumulation area ratio (AAR) in glaciated Mago river basin, Tawang District of Arunachal Pradesh, Eastern Himalaya using multispectral Landsat data, and remote sensing and GIS techniques over the period of 1988 – 2019.
The glacier surface extent was extracted using Automatic Glacier Extraction Index (AGEI) as it improved mapping accuracy compared to commonly used spectral indices by reducing water and shadow classification errors (Zhang et al., 2019). The weighted co-efficient and the threshold value are varied from 0 – 1 and 1.5 – 2.5, respectively. The best weighted co-efficient and threshold value for the study region were selected by comparing the processed image with high resolution Google Earth image. The weighted co-efficient of 0.5 and the threshold value of 2 was found to be the optimum values for generation of glacier surface extent in the study area. A total count of 49 glaciers named as G1 – G49 were observed in 2019, out of which 15 (G1, G2, G3, G4, G5, G8, G9, G15, G34, G35, G36, G38, G40, G41 and G42) glaciers were greater 1 sq. km and used them for glacial parameters change analysis. Based on the snout position, there 5 glaciers (G1, G3, G5, G15, G38) facing South direction, 4 glaciers (G2, G8, G35, G40) facing South West, 2 glaciers (G4, G9) facing South East, 2 glaciers (G34, G36) facing East, 1 glacier facing West and 1 glacier facing North.
The annual ELA of 15 glaciers was determined using two approaches, namely GIS tool developed by Pellitero (2015), and using topographic corrected NIR band of Landsat data and Otsu thresholding (Rastner et al., 2019). The ELA determined from these two approaches was compared in high resolution Google Earth image to check how well the ELAs were aligned with the glacier’s surface ablation/accumulation zone. This alignment check was done by checking the surface smoothness and roughness as the ablation area has a rough/patchy looking surface because of the retreatment whereas the accumulation area has a smooth looking surface. This comparison showed the ELA determined using Otsu thresholding gave a satisfactory result in the study area. Using the estimated ELA, the AAR of all glaciers were calculated.
All the glaciers showed a decreasing trend from 1988 to 2019. In the period between 1988 and 2010, the total loss was observed to be 6.26 km2 (11.71 % of the glacier surface area) at the shrinkage rate of 0.28 km2 per annum (0.53 % per annum). In the period between 2010 and 2019, there was a loss of 8.96 km2 (19 % of the glacier surface area) in the surface area. The shrinkage rate was found to be 0.90 km2 per annum, i.e., 1.9 % per annum. During the analysis period between 1988 and 2019, there was a loss of 15.22 km2 (28.48% of the glacier surface area) at the shrinkage rate of 0.49 km2 per annum (0.92 % per annum). The recent years’ analysis period showed higher shrinkage rate than the old periods. Based on orientation, in the period between 1988 and 2010, the South West glaciers lost maximum area (average loss of 18.44 % of glacier surface area) followed by South East glaciers (average loss of 12.33 % of glacier surface area); in between 2010 and 2019, the glaciers facing West loss maximum area (average loss of 28.77 % of glacier area), followed by South West (average loss of 26.67 % of glacier area); and in the period between 1988 and 2019, the glaciers facing towards South West lost maximum area (average loss of 50.70% of surface area) followed by West glaciers (average loss of 38.08% of surface area).
The ELA of all the glaciers showed increasing trend during the analysis period indicating that the ELA was shifted into the higher elevation zone. From the average ELA changes, the ELA was increased by 86.7 m @ 3.94 m/year, 50.7 m @ 7.85 m/year, and 137 m @ 4.43 m/year in the analysis period between 1988–2010, 2010–2019, and 1988–2019, respectively. Based on the glacier’s orientation, in the period between 1988 and 2010, SE facing glaciers had highest ELA increasing rate (7.28 m/year); in 2010–2019, South West facing glaciers had highest increasing rate (13.33 m/year) and in 1988–2019, East facing glaciers had highest ELA increasing rate (6.78 m/year). The AAR was found to be varied from 0.44 to 0.97 with an average of 0.75. the glaciers of South, South East, and North had AAR of around 0.8, South West and West facing glaciers showed around 0.6, and 0.74 was observed in East facing glaciers.